Streaming health: monitor throughput, latency, and writes
TLDR
Compare incoming records with destination writes, inspect latency and failed writes, and investigate a streaming pipeline in context.
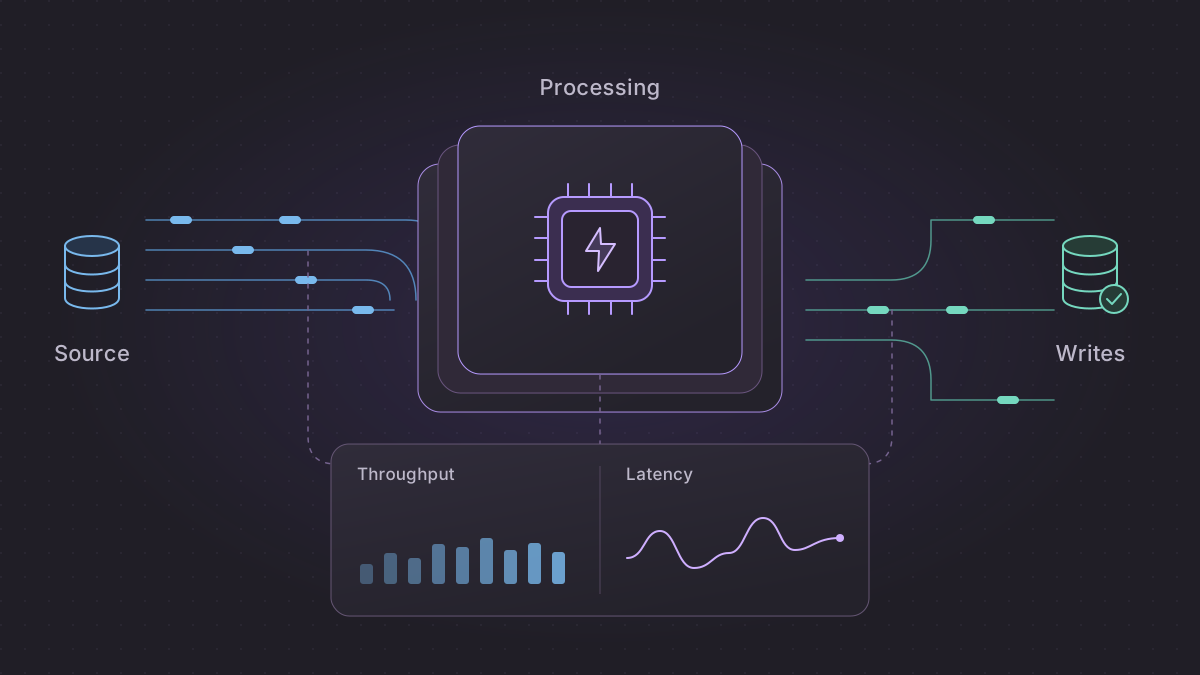
See whether your stream is keeping up
A running stream needs more than a run status. You need to know whether source records are arriving, whether destination writes are keeping pace, and where processing slows down. Streaming health brings those signals together on the monitoring page for a streaming pipeline.
This walkthrough reviews recorded metrics from a real public USGS earthquake feed: 12 consumed records, 12 destination writes, and no failed writes. The stream was stopped after the run; its stored metrics remain available to inspect.
Compare intake with destination writes
- Rows consumed. See how many records Mage accepted from the streaming source in the selected time range.
- Destination writes. Compare source consumption with accepted writes, including the contribution from each destination.
- Failed writes. Inspect write errors reported by the destinations that produced those metrics.
- Processing latency. Review average processing time when latency samples are available.
The throughput chart keeps source consumption separate from destination writes. A stream with multiple destinations can have more destination writes than consumed records, so the two totals are not always expected to match.
Move from a signal to its context
- Open a streaming pipeline and select Monitoring.
- Compare consumed records, destination writes, failed writes, and average latency.
- Change the time range or use a custom UTC range to focus the charts on the period you need.
- Inspect the throughput and processing-latency charts, then review destination and trigger health.
Destination rows show each destination block’s exported count, failed writes, and last successful write. Trigger health groups streaming runs under their trigger, keeping replacement runs visible as part of the same operational stream.
Read the metrics in the right time window
Check the last metric update and bucket size alongside the charts. Longer time ranges use coarser buckets to keep charts usable while preserving totals for the selected range.
An empty bucket or a healthy label in stored history does not establish that a stream is currently running. Use the run and trigger state to check current execution. Destination write counts describe writes accepted by Mage; they are not an end-to-end delivery guarantee for a downstream business system.